
Trace parser is a very important utility program that helps developers to debug an application.
It shows every SQL statement and every method called by applicatione followed by its call stack code
These are the instructions to starts Tracing an application
Enable Trace Parser Database
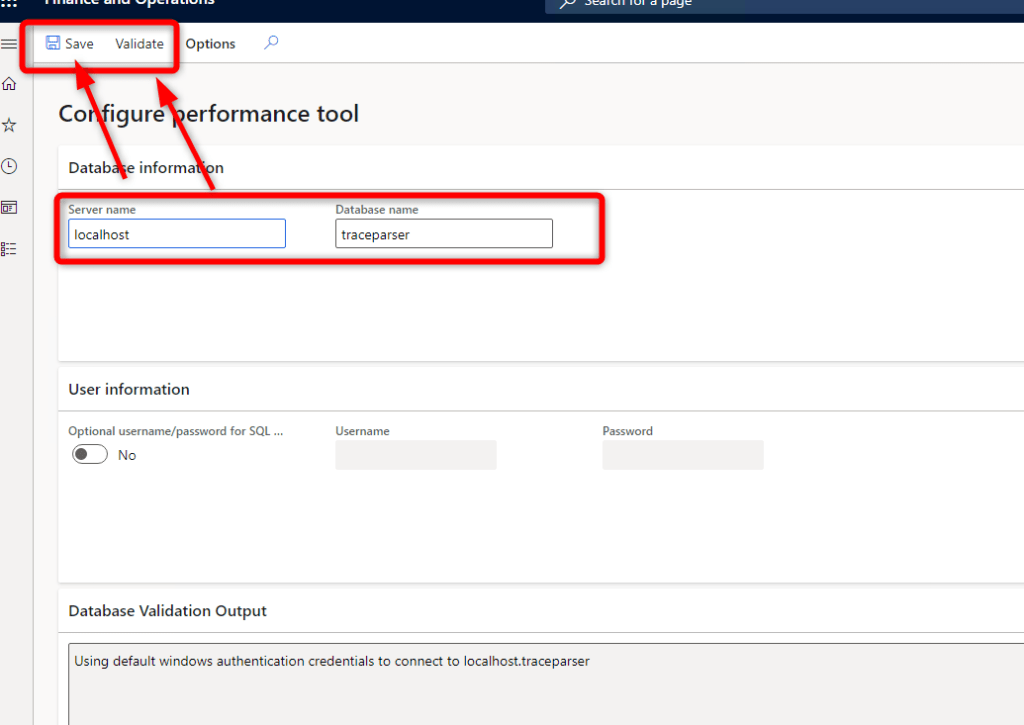
Go to “System administration” > “Check Performance tools”

Leave defaul parameters, click Validate ans Save
THis will generate a Trace Paser database on locahost SQL Server machine. This will also bind SQL server queries parameters.
Go to the application you want to trace and before starts anything click on “Trace”
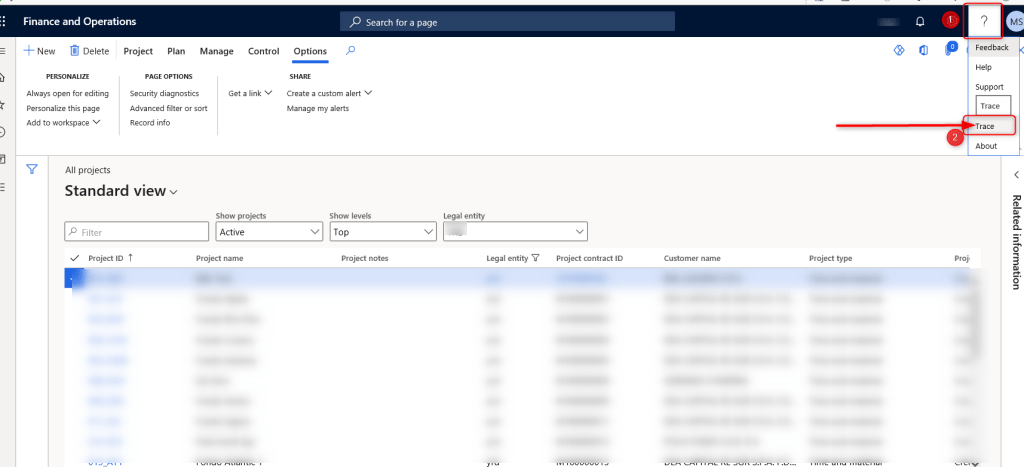
Give it a name such as test…. and click on “Start Trace”

Do whatever you want in you application and when finished click on “Stop Trace”

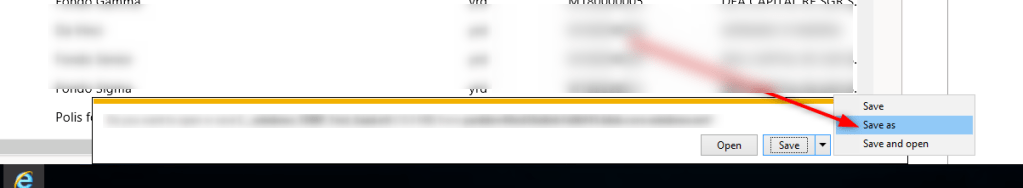
“Download Trace”

Save it where you want
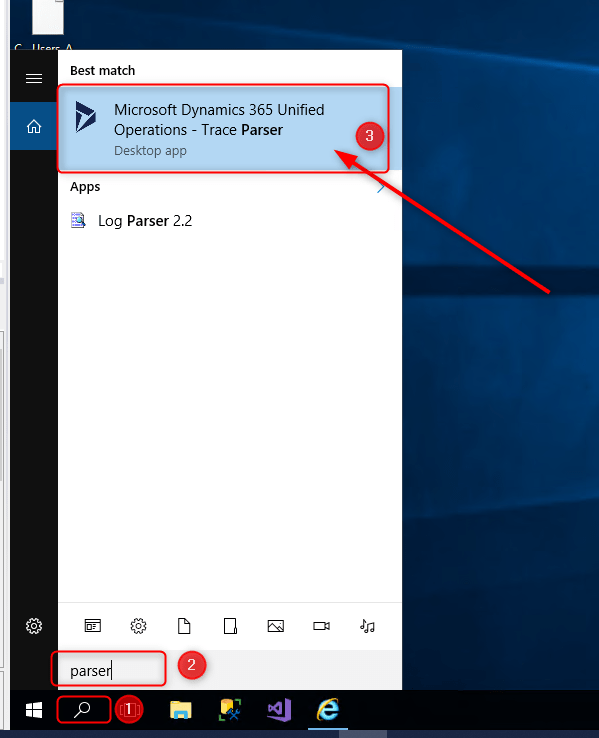
Search “…parser…” into Windows menu and open Trace Parser
The first time you use it, you must register a new databasea new. Just do it
Choose localhost > traceparser ad Register

After database creation import the trace log clicking on “Import trace”


………….Wait while importing………
In the “Select grouping” listview select the domani of the user you are logged into D365FO. In my case it’s altitudo.com

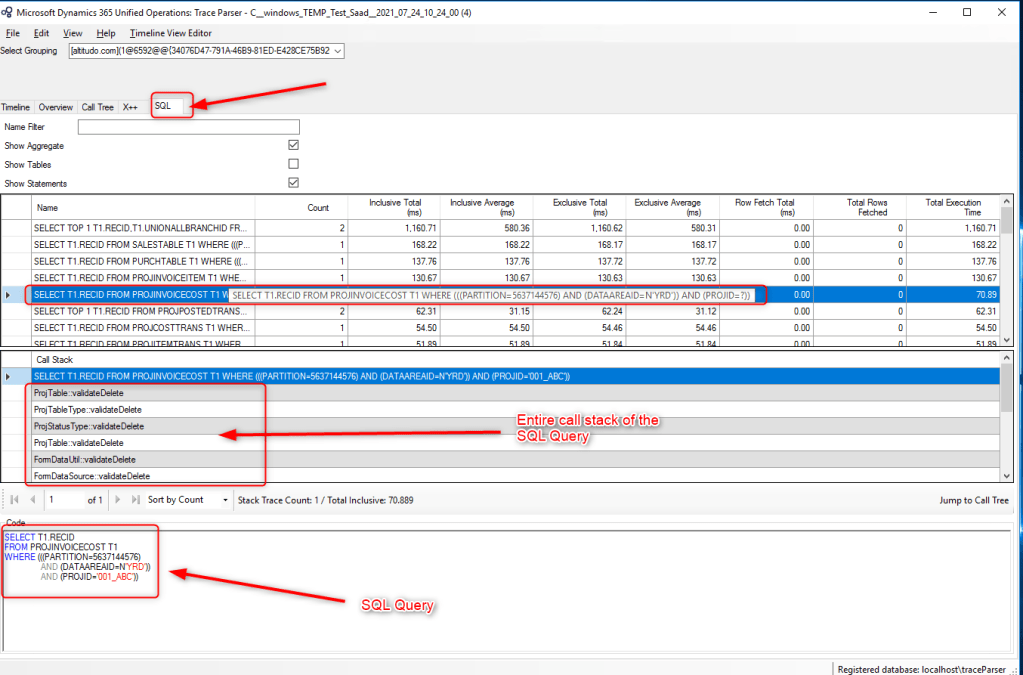
In “SQL” tab you can see every SQL statement and the method it was called from with the entire call stack code.
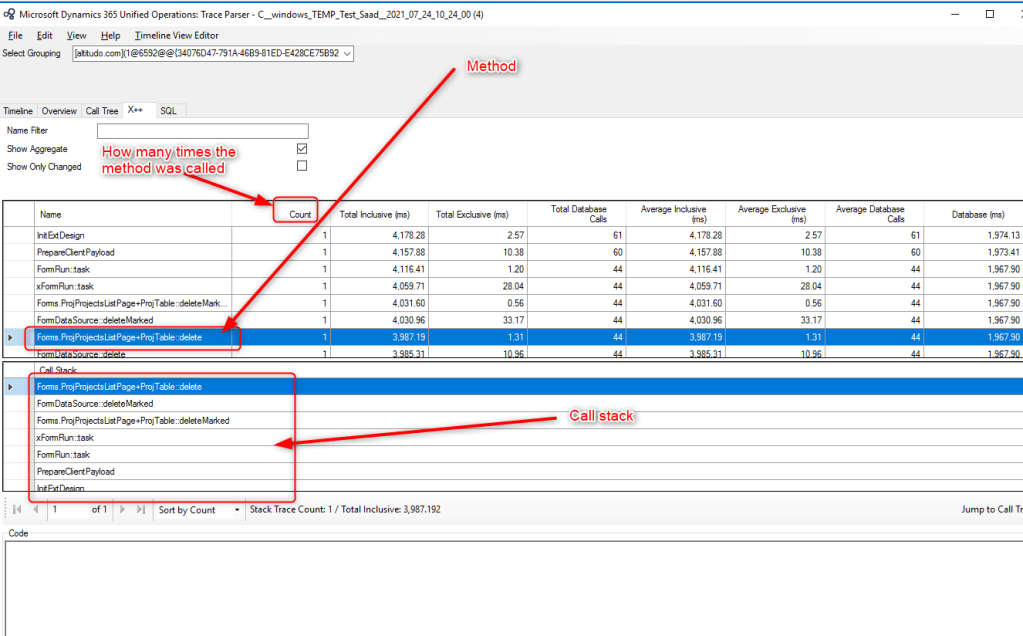
In X++ tab you can see every method used by application with its call stack. The are many other data analysis like the column “Count” that tells you how many times the method was called
In the “Call Tree” tab you can see all the methods used displayed in a tree view. The tree view shows the hierarchy of the methods and the link there is between them


Leave a comment